Mathematics for Machine Learning Archive
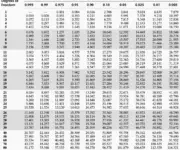
Chi-Square Distribution Table
On April 8, 2021 In Mathematics for Machine Learning, Probability and Statistics
Looking for an intuitive explanation of the Chi-Square distribution? Check out the blog post I wrote on the Chi-Square distribution and degrees of freedom. For a step-by-step explanation on Chi-Square testing, check out my post on the Chi-Square test for independence and goodness of fit. This post table is part of a blog post
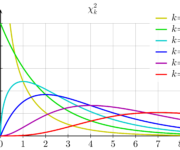
Chi-Square Distribution and Degrees of Freedom
On April 7, 2021 In Mathematics for Machine Learning, Probability and Statistics
In this post, we introduce the Chi-Square distribution discuss the concept of degrees of freedom learn how to construct Chi-Square confidence intervals If you want to know how to perform chi-square testing for independence or goodness of fit, check out this post. For those interested, the last section discusses the relationship between the chi-square
Hypothesis Testing and P-Values
On April 3, 2021 In Mathematics for Machine Learning, Probability and Statistics
Hypothesis testing in statistics allows you to make informed decisions using data.In a hypothesis testing scenario, you have a null hypothesis that represents the status quo. Through the collection and analysis of data, you try to refute the null hypothesis in favor of an alternative hypothesis. If your tests are statistically significant, you can
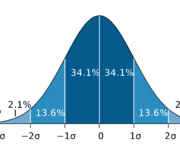
Confidence Intervals and Z Score
On March 25, 2021 In Mathematics for Machine Learning, Probability and Statistics
In this post, we learn how to construct confidence intervals. Confidence Interval Interpretation and Definition Confidence intervals are a type of statistical estimate to measure the probability that a certain parameter or value lies within a specific range. If we have data that is normally distributed, there is a 34.1% chance that a randomly
Geometric Distribution and Geometric Random Variables
On March 18, 2021 In Mathematics for Machine Learning, Probability and Statistics
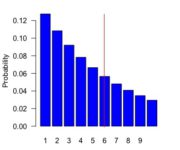
In this post we introduce the geometric distribution with an example and discuss how to calculate the probability of geometric random variables. The geometric distribution describes the probability of the number of failures before a successful outcome in a Bernoulli trial. Suppose you are a recruiter and you need to find a suitable candidate
Conjugate Priors
On March 14, 2021 In Mathematics for Machine Learning, Probability and Statistics
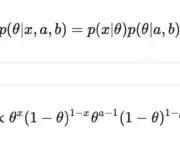
In this post we introduce the concept of conjugate priors and how they enable us to infer posterior parameters from prior distributions. The real world is messy and the probability of events is usually influenced by environmental factors. In statistics, we have methodologies for dealing with uncertainty and environmental influences such as the concept
The Beta Distribution
On March 8, 2021 In Mathematics for Machine Learning, Probability and Statistics
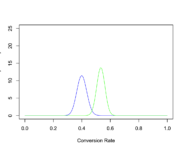
We build an intuitive understanding of the Beta distribution and its utility as a prior distribution for many other probability distributions. The beta distribution models a distribution of probabilities. If we don’t know the probability of the outcome of an event, we can use the beta distribution to model the distribution of probabilities given
Gamma Distribution
On March 3, 2021 In Mathematics for Machine Learning, None, Probability and Statistics
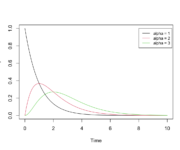
In this post we build an intuitive understanding of the Gamma distribution by going through some practical examples. Then we dive into the mathematical background and introduce the formulas. The gamma distribution models the wait time until a certain number of continuously occurring, independent events have happened. If you are familiar with the Poisson
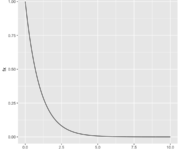
Exponential Distribution and Exponential Random Variables
On February 27, 2021 In Mathematics for Machine Learning, Probability and Statistics
We introduced the exponential distribution with a formal definition and some examples. We also learn how the exponential distribution relates to a Poisson process. The exponential distribution models the time interval between continuously occurring, independent events. In case you are familiar with the Poisson distribution, the exponential distribution models the wait time between events
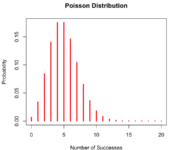
The Poisson Distribution
On February 22, 2021 In Mathematics for Machine Learning, Probability and Statistics
We introduce the Poisson distribution and develop an intuitive understanding of its uses by discussing examples and comparing the Poisson distribution to the binomial distribution. With the Poisson distribution, we can express the probability that a certain number of events happen in a fixed interval. Poisson Distribution Examples The Poisson distribution is useful in