Confidence Intervals and Z Score

In this post, we learn how to construct confidence intervals.
Confidence Interval Interpretation and Definition
Confidence intervals are a type of statistical estimate to measure the probability that a certain parameter or value lies within a specific range.
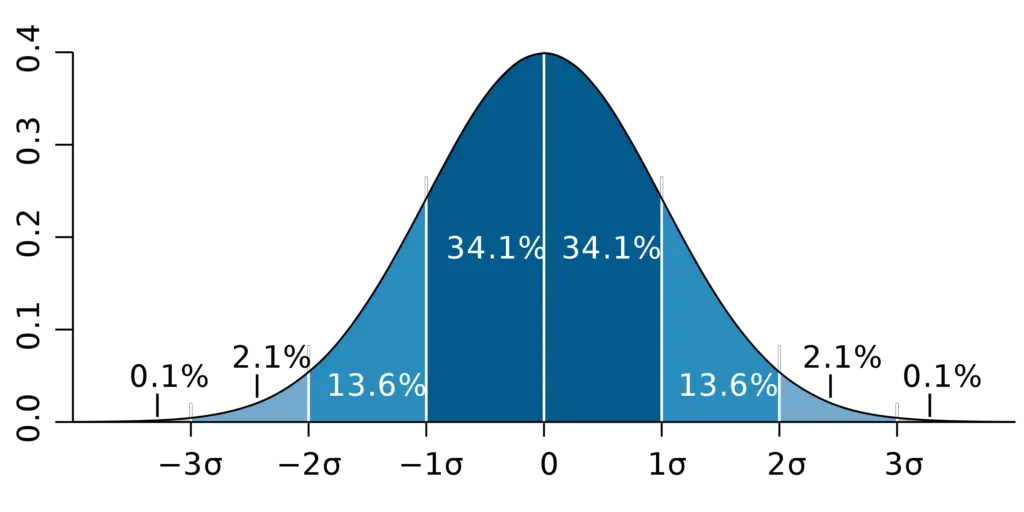
If we have data that is normally distributed, there is a 34.1% chance that a randomly sampled value from that data lies within one standard deviation above the mean and one standard deviation below the mean. If we were to repeatedly sample random values from that distribution, roughly 68.2% (34.1 + 34.1) would fall within one standard deviation from the mean. We have a 68% confidence interval.
Confidence intervals are usually calculated on samples of the data because you often don’t have the complete dataset available. You calculate the sample parameters such as the mean. The confidence interval then expresses your confidence that the sample parameter lies within a certain range from the real population parameter.
Let’s illustrate this with an example and the most commonly used confidence interval (the 95% interval).
95 Confidence Interval
If you hear people speaking about a 95 confidence interval, they mean that roughly 95% of the data lie within that interval. In a normal distribution, this means that 95% of the observations roughly lie within 2 (1.96 to be precise) standard deviations from the mean.
If you were to measure the distribution of heights of the adult population in a country, you probably don’t know the exact height of every single resident. Instead, you pick a representative sample that is large enough and calculate the mean and standard deviation of that sample. If you repeat this process over and over, 95% of your sample means will be less than 1.96 standard deviations from the true population mean.
Confidence Interval Formula using a Z Statistic
There are several ways to calculate confidence intervals such as the z statistic or z score and the t statistic. Which one you use, largely depends on your knowledge of the data.
Z Score vs T Score
If your sample size is large (n > 30) and you know the population standard deviation, a z score is appropriate.
If your sample size is small and your population variance is unknown, you can use a t-score.
Z Statistic
We already discussed how to calculate Z scores and normalized z scores in the context of the central limit theorem. Here is the formula for the normalized z score again:
Z_n = \frac{\bar X_n - \mu}{\frac{\sigma}{\sqrt{n}}} The z score gives us an estimate of the number of standard deviations that an observation lies from the mean. The exact z score depends on the selected confidence interval. In our case, we want to know how far the sample mean is from the population mean.
To estimate this confidence interval, we thus calculate the normalized standard deviation and multiply it by the appropriate z score. Then, we subtract and add the result from our population mean.
\bar{x } \pm z \frac{\sigma}{\sqrt{n}}Let’s calculate the population mean using a concrete example.
Assume we wanted to estimate the distribution of heights in the population of a country. We know that the standard deviation is 10cm (4 inches) and we take a sample of 100 people. The mean of the sample is 170cm (67 inches).
The first step is to decide which confidence level we want to use. We stick with 95%. To obtain a z-score, we need to calculate the alpha level. The alpha level describes the likelihood that our true population mean lies outside the confidence interval. Since we want to be 95% confident that the true population mean lies inside our interval the alpha level is simply the complement from 0.95 to 1
alpha = 1 - 0.95 = 0.05
But in our case, the confidence interval is two-sided. Therefore, the alpha value has to be split between both sides:
0.05/2 = 0.025
In other words, a 95% confidence interval comprises all values above the 2.5th percentile and below the 97.5th percentile (1-0.025 = 0.975).
If you only have the percentile, Z scores are commonly derived from lookup tables. In this case, we need the Z-score for the 97.5th percentile, which is 1.96. You can go into a Z score table and check this for yourself.
170 \pm 1.96 \frac{10}{\sqrt{100}} = 171.96 \; and \; 168.04Based on our sample, we are 95% confident that the true population mean lies between 168.04cm (66.15 inches) and 171.96cm (67.07 inches)
Summary and Further Resources
We’ve learned how to construct confidence intervals using the Z statistic. This post is part of a series on statistics for machine learning and data science. To read other posts in this series, go to the index.
For more in-depth coverage of these topics, I recommend the following online courses on Coursera. I’ve frequently referred to them while writing this blog post series:
If you don’t have a strong mathematical background, this basic statistics course is great.
If you have a working knowledge of calculus and linear algebra, check out the advanced statistics for data science specialization.

