Hypothesis Testing and P-Values

Hypothesis testing in statistics allows you to make informed decisions using data.
In a hypothesis testing scenario, you have a null hypothesis that represents the status quo. Through the collection and analysis of data, you try to refute the null hypothesis in favor of an alternative hypothesis. If your tests are statistically significant, you can reject the null hypothesis in favor of the alternative hypothesis.
The P-Value for Hypothesis Testing
The p-value expresses your confidence that the observed result is due to chance. If the p-value is low, you are more confident that your result is not due to chance but that whatever you are testing has a real effect. If the p-value is below a certain threshold, the outcome of your test can be considered statistically significant and you have reason to reject the null hypothesis.
How does this work in practice?
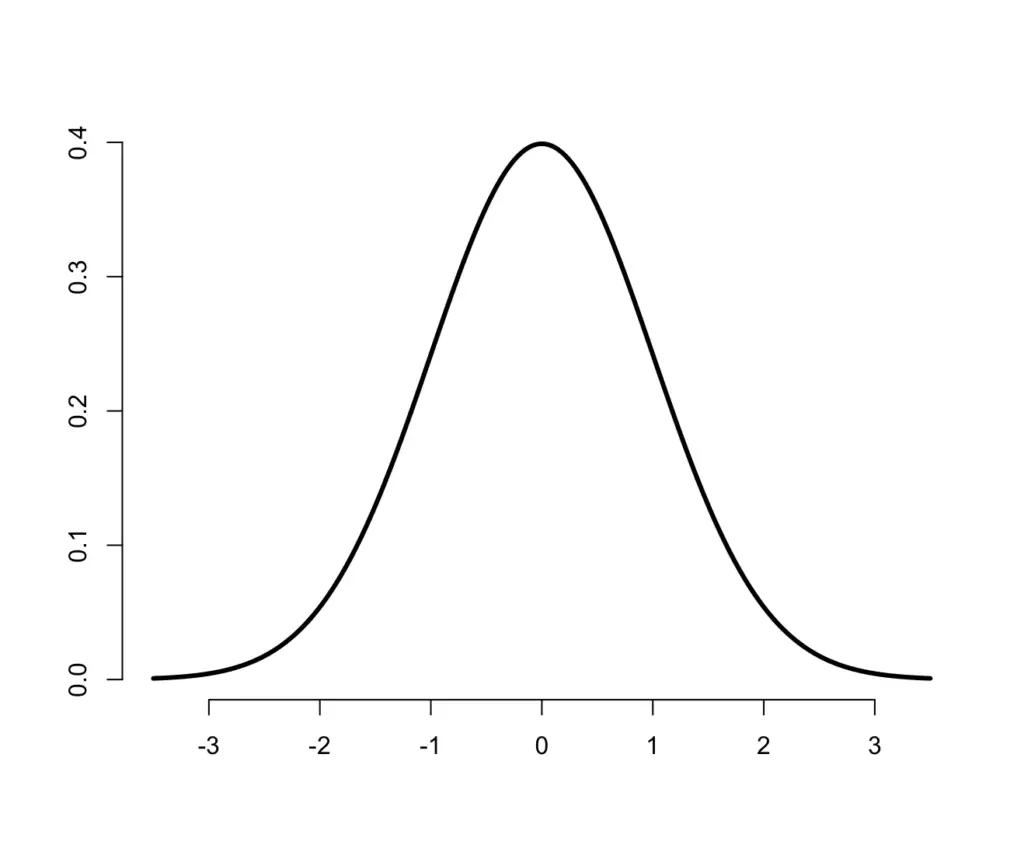
You usually start with a problem that has a normal distribution associated with it such as the distribution of systolic blood pressure measurements in patients. The mean systolic blood pressure is probably somewhere around 130 and deviates upwards or downwards in most patients. Let’s center the distribution at zero instead of 130.
Let’s say you want to introduce a treatment for reducing systolic blood pressure. You would test the treatment on a subsample of patients. The mean of your original population would be zero. According to your null hypothesis, you would not expect the mean of your treated patients to differ significantly from the mean of the untreated population.
But if the mean of your measurements differs from your original mean by a large margin, it is highly unlikely that this is due to chance and you reject your H0.
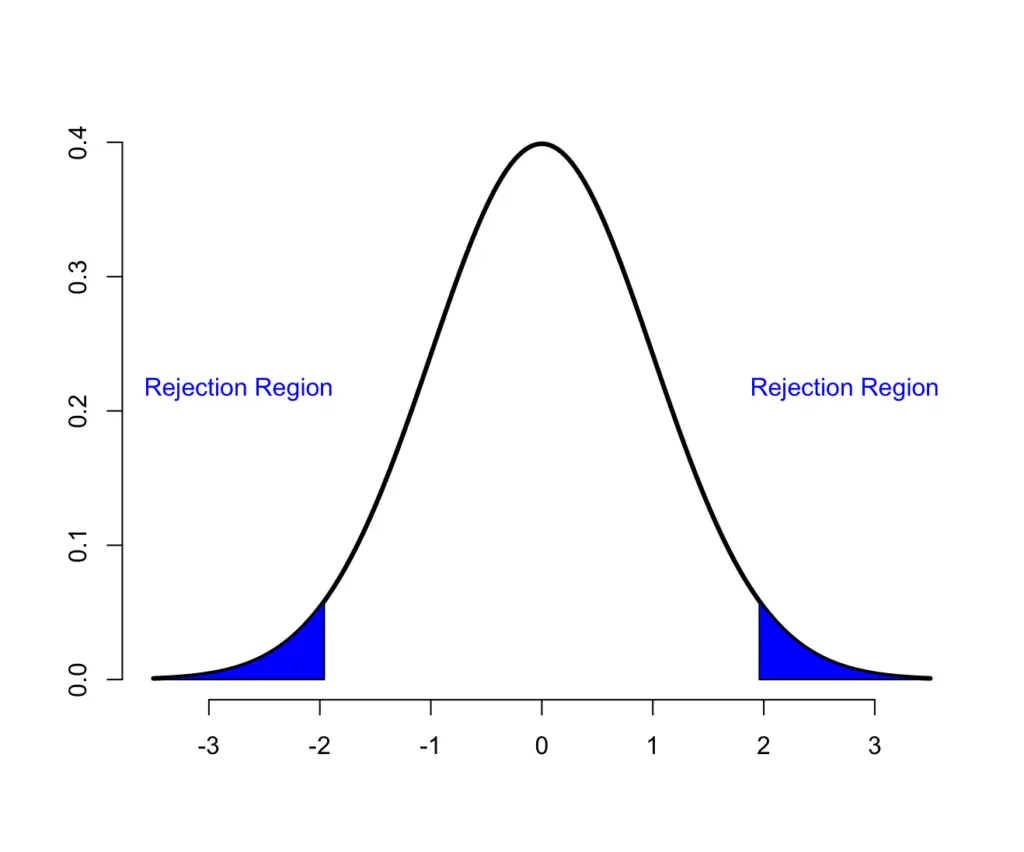
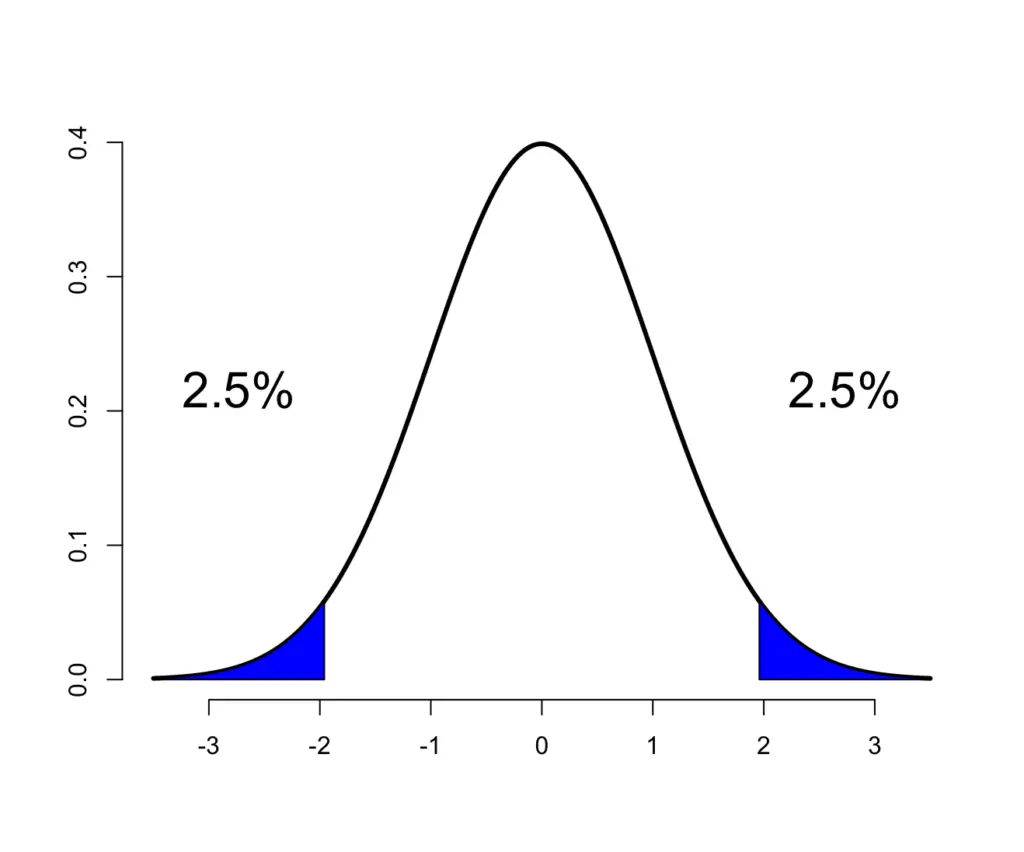
To determine what kind of deviation is significant, you pick a significance level (5% is most commonly used). Then you start performing some tests with your treatment and evaluate the mean systolic blood pressure. You want to know whether the blood pressure differed either upwards or downwards. Therefore, you would consider your test results significant if they fall within the most extreme 2.5% on both sides of your normal distribution.
Hypothesis Testing Examples
Enough of the abstract explanations! Let’s get our hands dirty.
Assume you are in charge of a school and you want to introduce a novel teaching method that has the potential to help children score higher on a standardized test. The current mean grade is 60 out of 100 points.
Your null hypothesis H0 stipulates that the novel method has no effect.
You run a study trial where 100 children are taught using the novel method. After the trial period, you find that the mean grade among the 100 children is 66 with a standard deviation of 20. Does this result present significant evidence (significance level of 5%) that your novel method indeed did had an effect on children’s test scores and to reject H0?
How To Calculate the P-Value
To find out whether our result is statistically significant, we can use the Z score since our sample size is > 30. The Z Test is a significance test based on the z score. Remember, the z score tells us how many standard deviations from the population mean our sample observation lies. If it lies far enough from the mean to fall into our rejection region, we can conclude that the test has statistical significance.
We want to know if the standard deviation of the mean of our sample from the population mean is significant. To estimate the standard deviation of the mean of our sample, we divide the sample standard deviation s by the square root of the sample size k.
\sigma = \frac{s}{\sqrt{k}} = \frac{20}{\sqrt{100}} = 2Now we can apply the formula for the Z-Score where μ is the population mean and x_bar ist the observed sample mean.
Z = \frac{ \bar x - \mu}{\frac{s}{\sqrt{k}}} = \frac{66-60}{\frac{20}{\sqrt{100}}}Z = \frac{66-60}{2} = 3So our Z Score tells us that our result is 3 standard deviations above the mean. By looking at a Z-table, we know that 99.7% of observations fall within 3 standard deviations of the mean. In other words, there is only a 0.3% probability that we observe a grade point average of 66 by pure chance when the true mean is 60.
Our p-value is 0.3%. In plain English this means that the probability to see the observed deviation from the mean if H0 was true, is 0.3%.
Since 0.3% is much lower than 5% (our significance level), we conclude that our learning method does indeed improve test outcomes for children. We reject H0.
Hypothesis Testing Using Confidence Intervals
Since our significance level is 5%, we use a 95% confidence interval. From the Z-Table we also know that the rejection areas for a two-sided 95% confidence interval lie 1.96 standard deviations above and below the mean.
So we can calculate the exact confidence interval beyond which we reject our null hypothesis by plugging it into our formula for the z-score. The only difference is, that the z-score is known and we need to find the value C that marks the boundary of our confidence interval.
1.96 = \frac{C-60}{2}C = 60 \pm 1.96 \times 2
C = [56.08, 63.92]
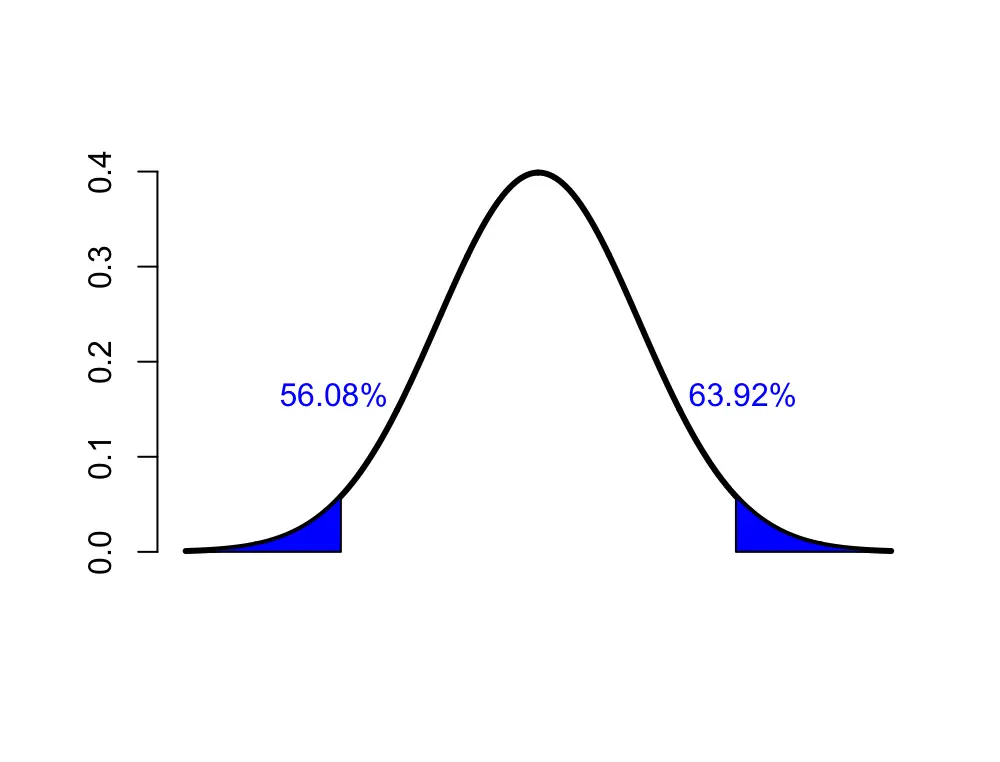
Our 95% confidence interval ranges from 56.08 to 63.92. A learning method that results in average scores below 56.08 or above 63.92 can be considered statistically significant with respect to its effect on improving student test scores.
Note: We’ve used the z-score here for hypothesis testing. You can apply the same procedure using the t-score.
Summary
We introduced hypothesis testing using p-values and confidence intervals.
This post is part of a series on statistics for machine learning and data science. To read other posts in this series, go to the index.


