Probability and Statistics Archive
T-Tests: A comprehensive introduction
On June 14, 2021 In Mathematics for Machine Learning, Probability and Statistics
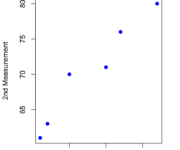
In this post, we define the t-test in statistics, explain what different t-tests exist, and demonstrate by example how we can use them to find the differences between means in various scenarios. What is a T-Test? The t-test tests the significance of the difference of measured means. Differences can be measured within the same
Chi-Square Test for Independence and Goodness of Fit
On May 5, 2021 In Mathematics for Machine Learning, Probability and Statistics
In this post, we will introduce the chi-square test. We discuss how to calculate a chi-square statistic, how to perform a chi-square test for independence, and finally how to use the chi-square test for goodness of fit. What is a Chi-Square Test? Pearson’s chi-square test in statistics measures the difference between an observed value
Type 1 and Type 2 Error
On April 18, 2021 In Mathematics for Machine Learning, None, Probability and Statistics
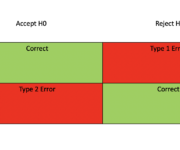
When you are testing hypotheses, you might encounter type 1 and type 2 errors. Identifying them and dealing with them is essential for setting up statistical testing scenarios. They also play a huge role in machine learning. What is a Type 1 Error in Statistics? When you reject the null hypothesis although it is
Z Score Table for Confidence Intervals
On April 13, 2021 In Mathematics for Machine Learning, Probability and Statistics
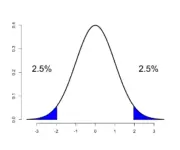
Negative Z Table These are z-values to the left of the mean. Positive Z Table These are z-values to the right of the mean. Two-Sided Z-Score Table These are z_Value to the left and the right of the mean.
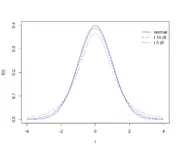
Student’s T-Distribution
On April 12, 2021 In Mathematics for Machine Learning, Probability and Statistics
In this post we introduce student’s t-distribution and learn how to construct t-confidence intervals. The t distribution is usually applied when you want to estimate the mean of normally distributed data but the sample size is small and you don’t know the population standard deviation. Like the Chi-Square distribution, it relies on degrees of
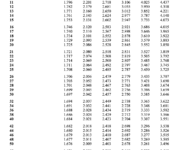
T- Distribution Table
On April 12, 2021 In Mathematics for Machine Learning, Probability and Statistics
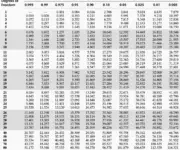
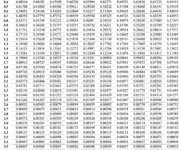
Chi-Square Distribution Table
On April 8, 2021 In Mathematics for Machine Learning, Probability and Statistics
Looking for an intuitive explanation of the Chi-Square distribution? Check out the blog post I wrote on the Chi-Square distribution and degrees of freedom. For a step-by-step explanation on Chi-Square testing, check out my post on the Chi-Square test for independence and goodness of fit. This post table is part of a blog post
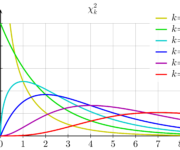
Chi-Square Distribution and Degrees of Freedom
On April 7, 2021 In Mathematics for Machine Learning, Probability and Statistics
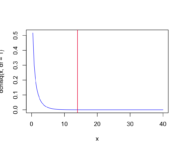
In this post, we introduce the Chi-Square distribution discuss the concept of degrees of freedom learn how to construct Chi-Square confidence intervals If you want to know how to perform chi-square testing for independence or goodness of fit, check out this post. For those interested, the last section discusses the relationship between the chi-square
Hypothesis Testing and P-Values
On April 3, 2021 In Mathematics for Machine Learning, Probability and Statistics
Hypothesis testing in statistics allows you to make informed decisions using data.In a hypothesis testing scenario, you have a null hypothesis that represents the status quo. Through the collection and analysis of data, you try to refute the null hypothesis in favor of an alternative hypothesis. If your tests are statistically significant, you can
Confidence Intervals and Z Score
On March 25, 2021 In Mathematics for Machine Learning, Probability and Statistics
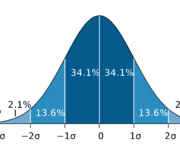
In this post, we learn how to construct confidence intervals. Confidence Interval Interpretation and Definition Confidence intervals are a type of statistical estimate to measure the probability that a certain parameter or value lies within a specific range. If we have data that is normally distributed, there is a 34.1% chance that a randomly