Chi-Square Distribution and Degrees of Freedom

In this post, we
- introduce the Chi-Square distribution
- discuss the concept of degrees of freedom
- learn how to construct Chi-Square confidence intervals
If you want to know how to perform chi-square testing for independence or goodness of fit, check out this post.
For those interested, the last section discusses the relationship between the chi-square and the gamma distribution.
The Chi-Square Distribution
The Chi-Square distribution is commonly used to measure how well an observed distribution fits a theoretical one. This measurement is quantified using degrees of freedom. In the context of confidence intervals, we can measure the difference between a population standard deviation and a sample standard deviation using the Chi-Square distribution.
In a nutshell, the Chi-Square distribution models the distribution of the sum of squares of several independent standard normal random variables.
Thus, you can get to the simplest form of the Chi-Square distribution from a standard normal random variable X by simply squaring X.
Q_1 = X^2
The plot of this function looks like this:
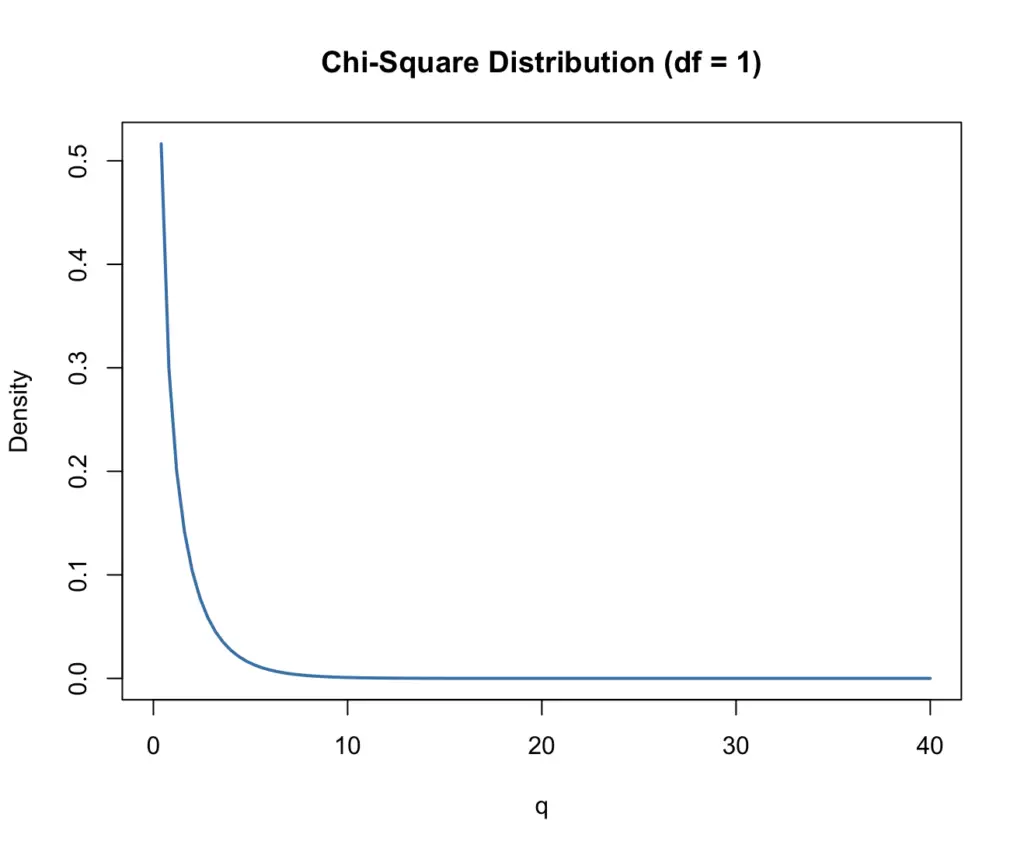
As you can see, the curve rapidly declines to almost zero as q increases. The values q of our distribution here are basically squared random draws from a standard normal distribution. Since the standard normal distribution has a mean of zero, most draws will be close to zero. If you square a number <1, it becomes even smaller. Draws of larger values are increasingly unlikely. Squaring the value also has the effect that all values will be positive.
We can construct a Chi-Square distribution with an arbitrary number of k random variables.
Q_k = X_1^2 + X_2^2 +...+X_k^2
What are Degrees of Freedom?
The number of independent random variables that go into the Chi-Square distribution is known as the degrees of freedom (df). There isn’t a clear-cut definition of degrees of freedom. But as the name implies, you can think of it as the number of variables that can vary. The more variables you add, the more variability you introduce, and thus the more degrees of freedom you have.
Please note that this is by no means a rigorous definition. A professional statistician might disagree with it.
In the following plot, you see how the pdf of the Chi-Square distribution changes based on the degrees of freedom.
Note: Here we are using the greek letter χ, which looks confusingly similar to x.
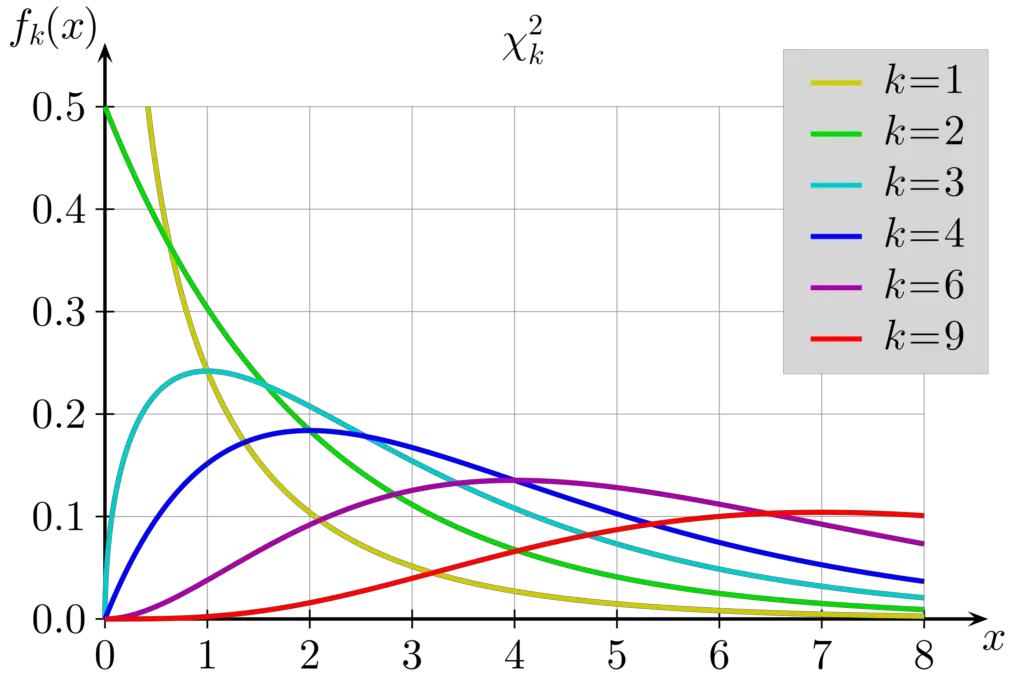
Since we are adding up the squared values of k draws from a random normal distribution, the bulk of our values will now cluster around higher values of q (οr χ). In fact, the mean of the Chi-Square distribution is equal to the degrees of freedom.
Chi-Square Confidence Intervals
We can use the Chi-Square distribution to construct confidence intervals for the standard deviation of normally distributed data. Given a sample from a normally distributed population
N(\mu,\sigma^2)
the proportion of the sample variance s^2 times the sample variance (n-1) to the population variance sigma^2 follows a chi-square distribution with n-1 degrees of freedom.
\Chi^2 = \frac{(n-1)s^2}{\sigma^2}After choosing the significance level α, we can construct a confidence interval that contains (1- α)100% values. If we set the significance level at 5%, the confidence interval contains 95% of values.
Now we can look up the Χ^2 corresponding to our critical values in a lookup table. All we need to know is the degrees of freedom which is equivalent to the sample size n minus 1.
Our Chi-Square obtained from the formula must lie between the two critical values.
\Chi^2_{1- \alpha/2} < \frac{(n-1)s^2}{\sigma^2} < \Chi^2_{\alpha/2}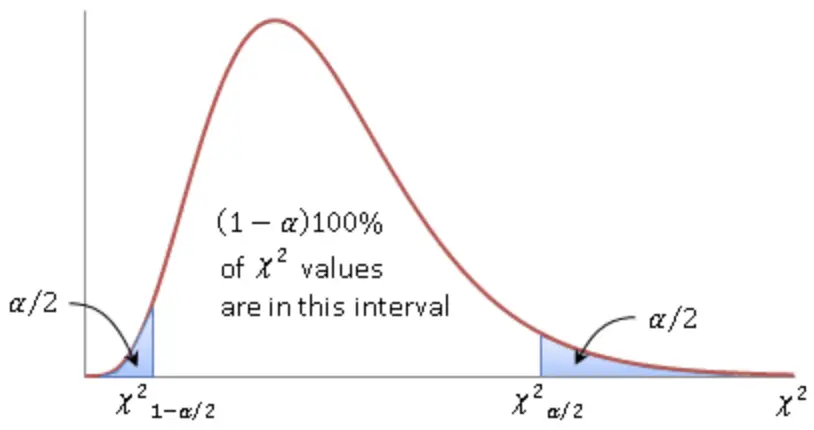
Rearranging terms gives us the following inequality.
\frac{(n-1)s^2}{\Chi^2_{\alpha/2}} < \sigma^2 < \frac{(n-1)s^2}{\Chi^2_{1-\alpha/2}} Accordingly, we gave a confidence interval of the following form:
[\frac{(n-1)s^2}{\Chi^2_{\alpha/2}} , \frac{(n-1)s^2}{\Chi^2_{1-\alpha/2}} ]Let’s do an example to make this clearer.
Assume we have a population n of 41 students and we want to introduce a new test. The sample standard deviation on that test is s 10. We want to calculate a two-sided 95% confidence interval for the standard deviation.
First, we have to go into the Chi-Square table and look up the critical values. We have 40 degrees of freedom and our confidence interval is two-sided with 95%. This means we have to look for the 2.5th percentile and the 97.5 percentile.
\Chi^2_{1-\alpha/2} = \Chi^2_{0.975} = 24.433 \\
\Chi^2_{\alpha/2} = \Chi^2_{0.025} = 59.342
Next, we plug this into our formula for the confidence intervals
\frac{(n-1)s^2}{\Chi^2_{\alpha/2}} < \sigma^2 < \frac{(n-1)s^2}{\Chi^2_{1-\alpha/2}} \frac{(41-1)10^2}{59.342} < \sigma^2 < \frac{(41-1)10^2}{24.433} 67.04 < \sigma^2 < 163.71
8.19 < \sigma < 12.79
We are 95% confident that our standard deviation lies between 8.19 and 12.79.
Chi-Square Distribution Formula
While x > 0 the probability density function of the Chi-Square distribution is
f(x)= \frac{x^{k/2-1}e^{-x/2}}{\Gamma(k/2)2^{k/2}}where k is the degrees of freedom. The Chi-Square distribution has the following mean and standard deviation.
\mu = k \;and\;\sigma^2 = 2k
If x is smaller than zero, the pdf is zero.
Relationship Between the Chi-Square and the Gamma Distribution
The Chi-Square is a special distribution of the Gamma distribution. The Gamma distribution is parameterized by a shape parameter α and the rate parameter β in addition to x.
f(x; \alpha, \beta) = \frac{\beta^{\alpha} x^{\alpha - 1} e^{-\beta x}}{\Gamma(\alpha)}If we substitute
\alpha = \frac{k}{2} \;and\; \beta = \frac{1}{2}We get
f(x)= \frac{\frac{1}{2}^{k/2} x^{k/2-1}e^{-x/2}}{\Gamma(k/2)}f(x)= \frac{x^{k/2-1}e^{-x/2}}{\Gamma(k/2)2^{k/2}}which is equivalent to the Chi-Square distribution. We have basically reduced the number of parameters to the single parameter k instead of α and β. Compared to the Gamma distribution, in a Chi-Square we keep the rate parameter constant while the scale parameter varies with the degrees of freedom.
This post is part of a series on statistics for machine learning and data science. To read other posts in this series, go to the index.


