Chi-Square Test for Independence and Goodness of Fit

In this post, we will introduce the chi-square test. We discuss how to calculate a chi-square statistic, how to perform a chi-square test for independence, and finally how to use the chi-square test for goodness of fit.
What is a Chi-Square Test?
Pearson’s chi-square test in statistics measures the difference between an observed value and an expected value. To calculate this difference, we use the chi-squared statistic:
\Chi^2 = \sum^n_{i=1}\frac{(Observed_i - Expected_i)^2}{Expected_i}It is essentially a measure of distance between the entries of the observed and the entries of the expected value. The smaller the chi-square value, the better the fit and the stronger the indication of a relationship between the variables. Conversely, a larger value is indicative of a weaker relationship or no relationship at all.
Chi-Square Test for Independence
Let’s do a Chi-Square test example to check whether two variables are independent and illustrate how the test works in the process. We want to check whether speaking at least one foreign language as a recent graduate from high school has a notable impact on your ability to secure an entry-level job.
Our null hypothesis is that foreign language proficiency and the ability to find a job are independent.
The following table shows the number of graduates grouped by how long it took them to find a job upon graduation and whether they are monolingual or multilingual.
| Observed | <3 months | > 3 months | Total |
| Multilingual | 50 | 20 | 70 |
| Monolingual | 85 | 103 | 188 |
| Total | 135 | 123 | 258 |
The values in the table are the observed values. To get the expected values, we apply the following formula
Expected = \frac{row \;total \times column \; total }{overall \; total}For the first column this would resolve to:
E_{11} = \frac{70 \times 135}{258} = 36.63| Expected | <3 months | > 3 months |
| Multilingual | 36.63 | 33.37 |
| Monolingual | 98.37 | 89.63 |
Now, we can calculate the chi-squared statistic.
\Chi^2 = \frac{(50- 36.63)^2}{36.63} + \frac{(85- 98.37)^2}{98.37} + \frac{(20- 33.37)^2}{33.37} + \frac{(103- 89.63)^2}{89.63} = 14Note that if you calculate the Chi-square statistic using software, the value will probably differ by 1 because I’ve rounded all the intermediate values to two decimal places.
If we want to do the whole example by hand, we can calculate the degrees of freedom according to the following formula
DF = (number\; of \;rows -1)\times(number\,of\,columns - 1)
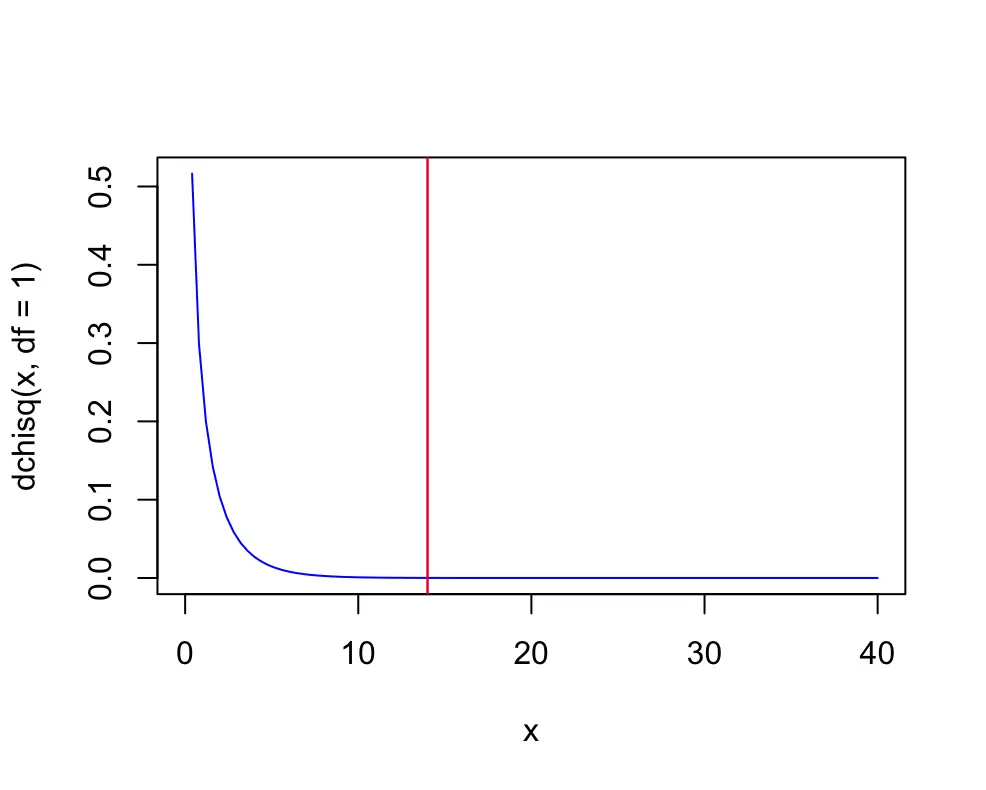
A Chi-Square distribution with one degree of freedom looks like this. The plot essentially shows us the evidence that the two variables are independent. The greater the value, the greater the evidence against independence. Our chi-square value is at the location of the red line. The evidence for independence is extremely small, so we can be pretty confident that the two variables are not independent.
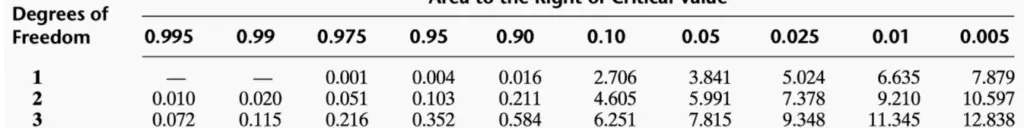
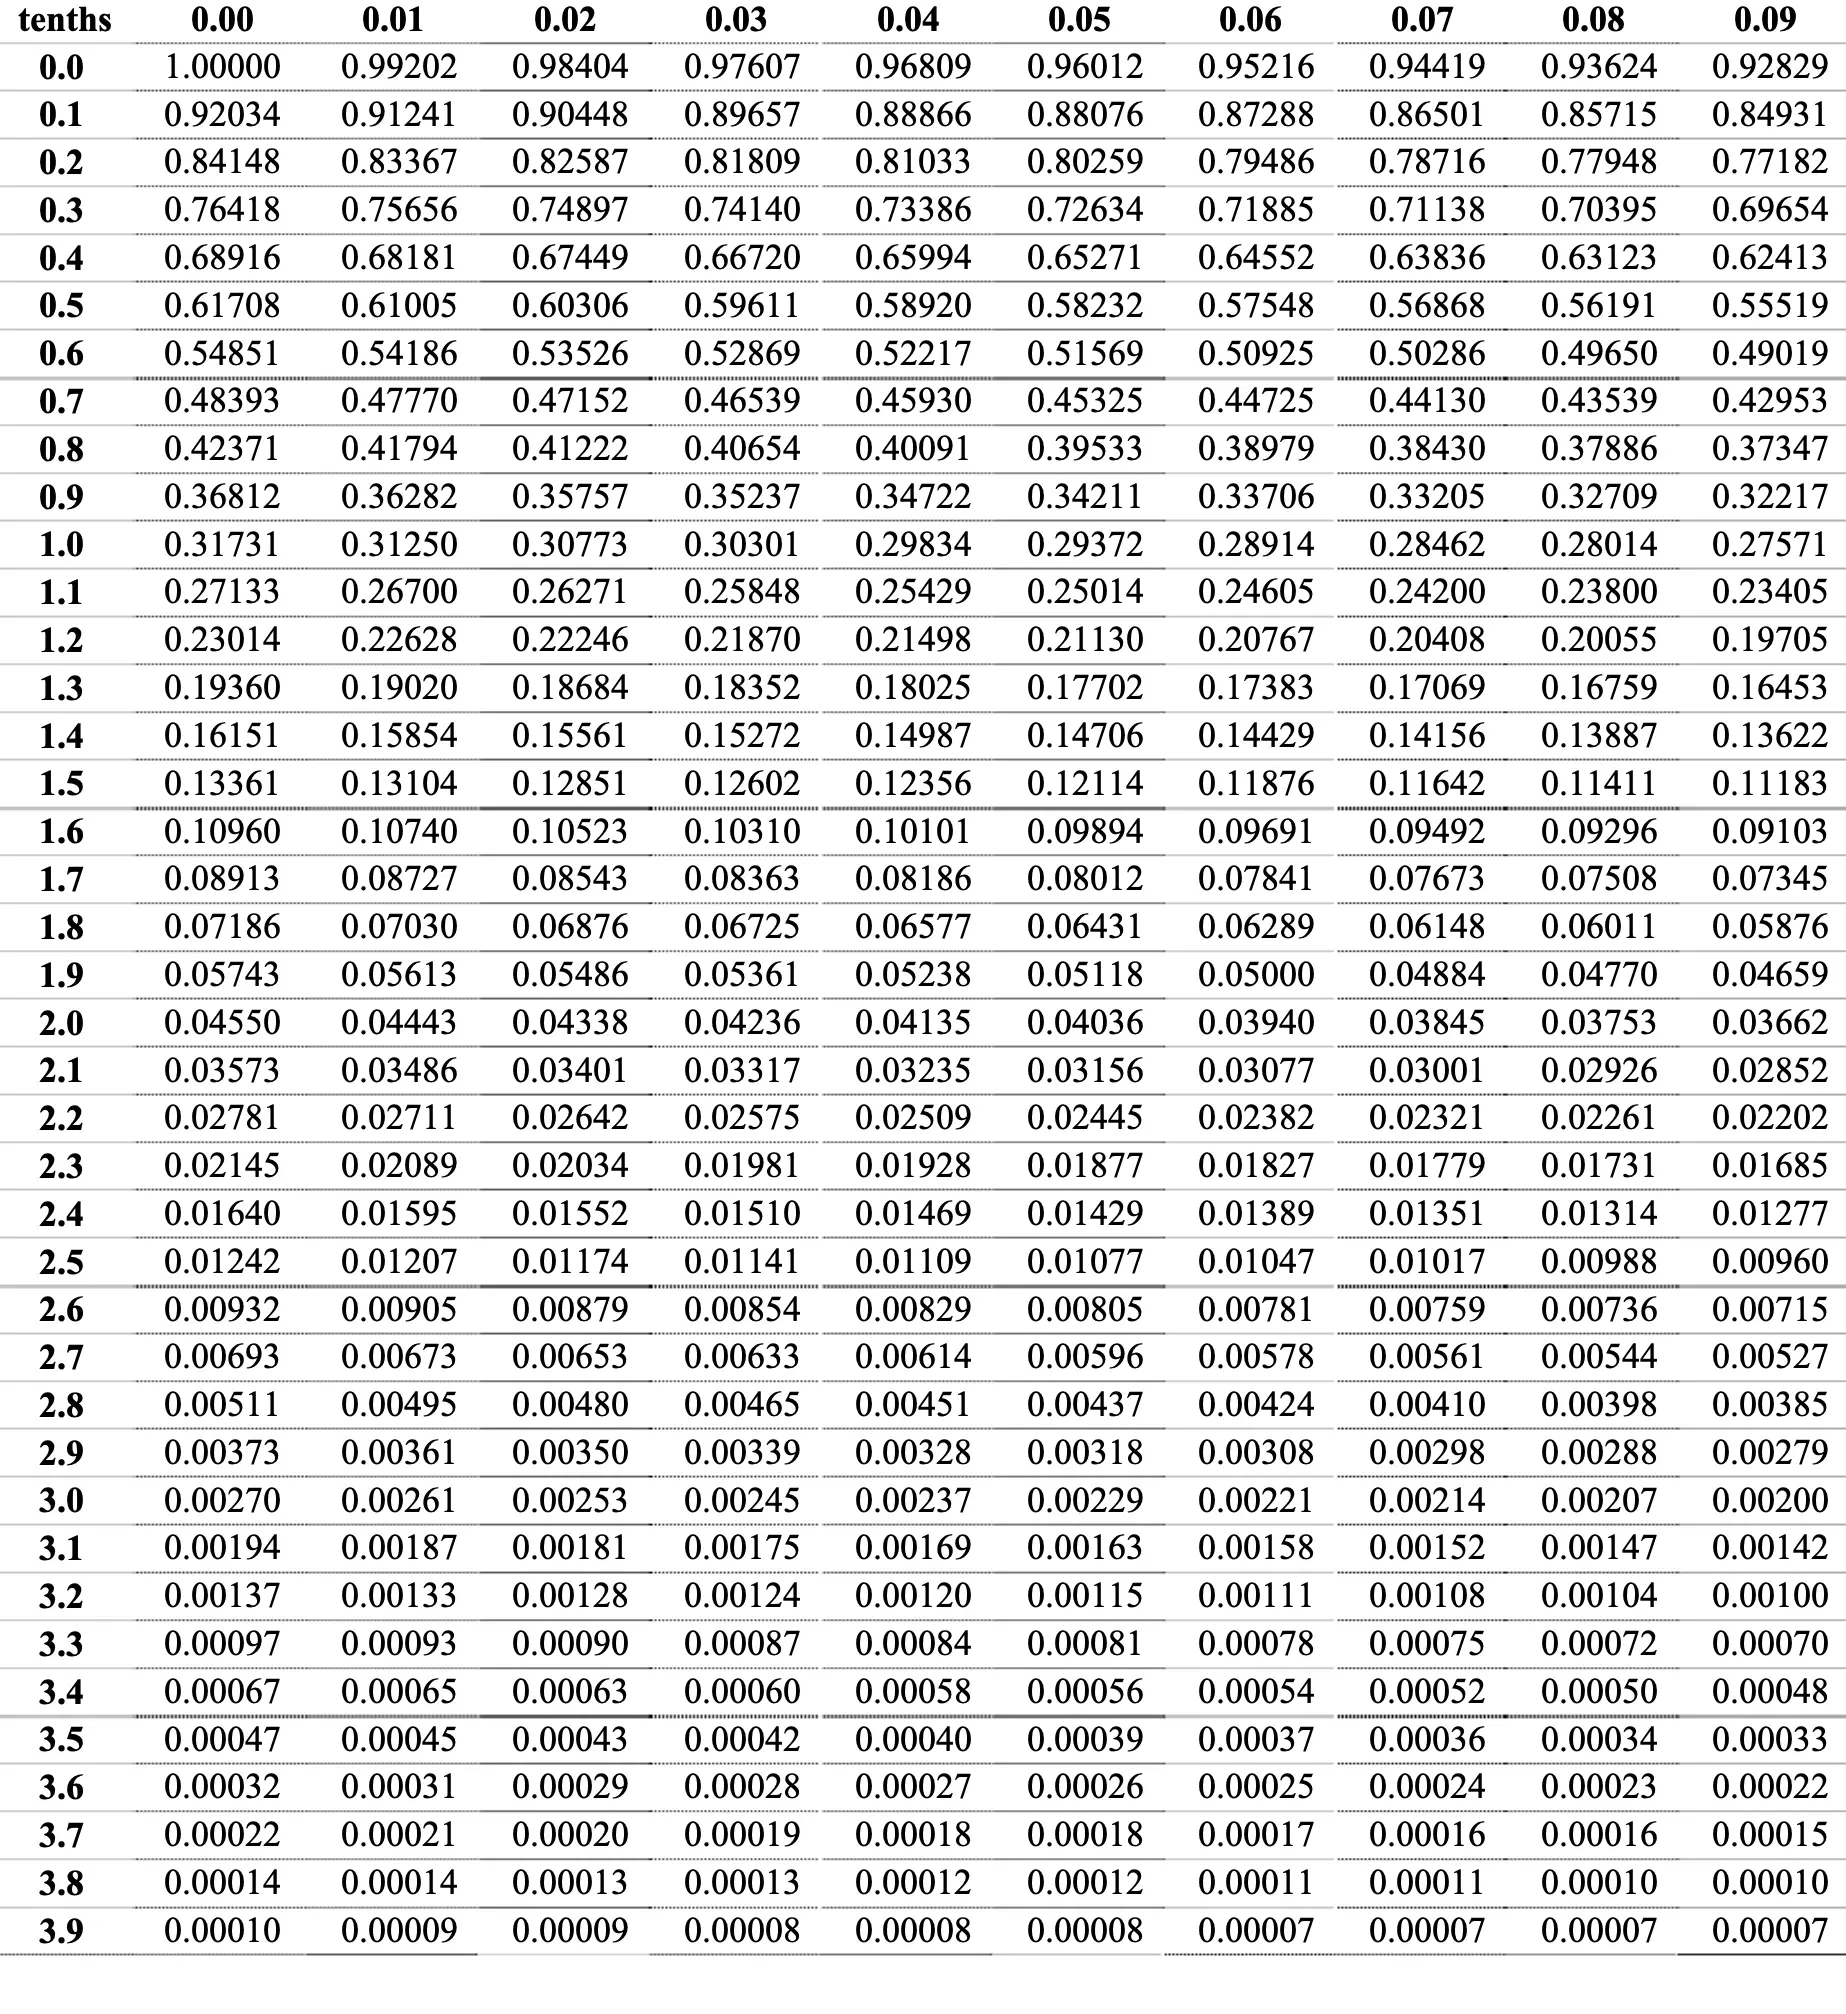
If we have a certain confidence level, we can go into a chi-square table and look up the critical value. If you look at the table you’ll see that in a chi-square distribution with 1 degree of freedom, only 0.005 % of observations have chi-square values greater than 7.879 if the variables were independent.
I’ve also calculated the p-value using R which checks out at 0.0003 providing strong evidence against the null hypothesis.
We can be pretty confident that the number of languages you speak and your ability to find a job upon graduation are not independent.
How to interpret the Chi-Square Test Results?
There are a few important things to keep in mind upon deciding when to use the chi-square test. The Chi-Square test only tells us that there is a relationship. It does not tell us what kind of relationship there is. Intuitively we would probably say that multilingual graduates have better job opportunities than monolingual ones. This might be true, but we cannot draw this conclusion lest we confuse correlation with causation. The Chi-Square test only tells us that the variables are related, but not that one is a cause of the other.
Consider the following scenario:
Many of the children in the study come from first-generation immigrant families. They speak their mother language and the language of the host country at an intermediate level. Accordingly, they are classified as bilingual. The non-immigrant children speak the language of the host country fluently but know no other languages.
Who do you think will have an easier time finding a job in the host country? The ones who are fluent in the language or those who speak it at an intermediate level? In this case the conclusion would be reversed
Furthermore, the job opportunities of children from immigrant families might be worse due to socioeconomic circumstances. They just also happen to be bilingual but it doesn’t really affect their ability to find a job. So there might be no causal relationship at all between being multilingual and the ability to find a job.
Chi-Square Test for Goodness of Fit
The chi-square test can also be applied to test how well the observed values fit a theoretical distribution.
Suppose you have an online shop and you record the number of visitors. Your null hypothesis is that on each day of the week you should see an equal number of people visiting your website. In other words, the number of visitors follows a uniform distribution. Let’s say you have 7000 people visiting your site in a week. According to your null hypothesis, these 7000 should split equally across the week giving you 1000 visitors per day.
You record the number of people for a week and you get the following values:
| Monday | Tuesday | Wednesday | Thursday | Friday | Saturday | Sunday | |
| Observed | 1600 | 1200 | 1100 | 1000 | 900 | 800 | 400 |
| Expected | 1000 | 1000 | 1000 | 1000 | 1000 | 1000 | 1000 |
If you want to calculate the chi-square value manually, you could go through the same steps as above. But I am going to use R here to perform the test. R returns the following results:
\Chi^2 = 446.03, \;df = 6, \;p-value < 0.00000000000000022
As you’ve probably guessed from looking at the data, the number of visitors does not follow a uniform distribution. The p-value and the chi-square value give us overwhelming evidence to reject the null hypothesis.
