Normal Distribution and Gaussian Random Variables

In this post, we introduce the normal distribution and its properties. We also learn how to calculate Z scores and standard deviations from the mean.
The normal distribution also known as the Gaussian distribution is the most commonly used probability distribution. The normal distribution curve has the famous bell shape.
Many real-world random variables seem to be approximately normally distributed. Accordingly, the normal distribution is a sensible choice if you have little to no prior knowledge about the data that indicates how it is distributed.
Normal Distribution Formula
The Gaussian distribution is defined by two parameters, the mean and the variance. When we want to express that a random variable X is normally distributed, we usually denote it as follows.
X \sim N(\mu, \sigma^2)
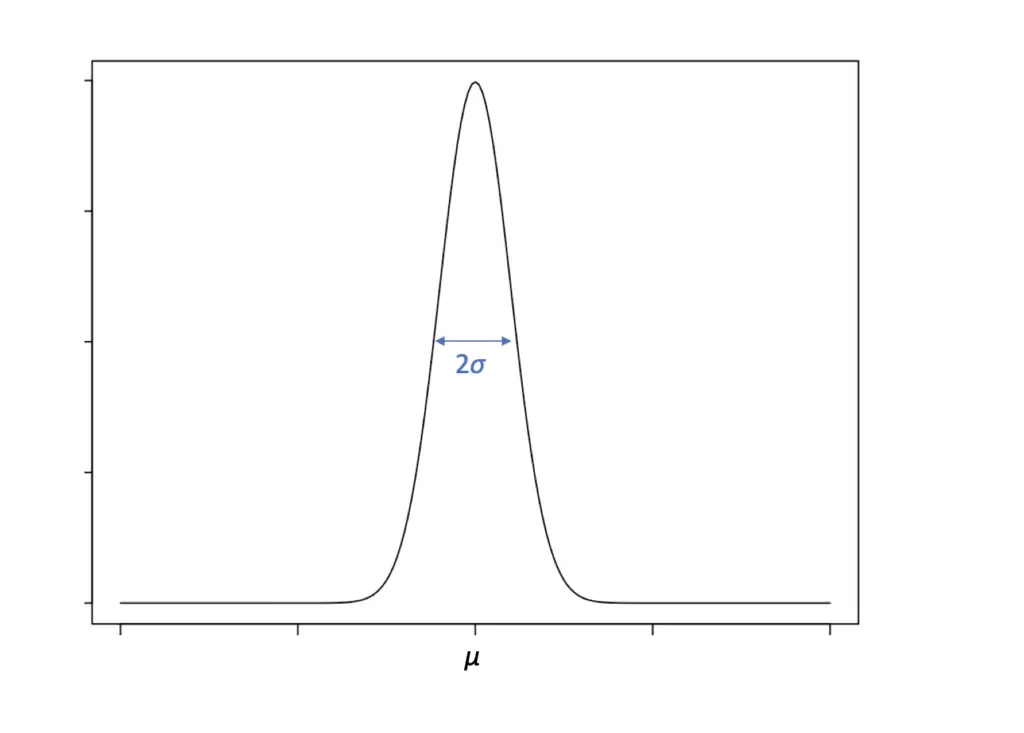
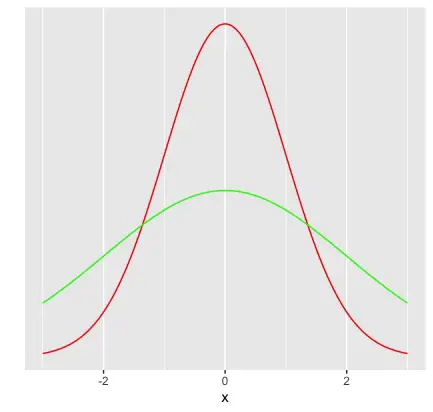
The mean μ defines the location of the center and peak of the bell curve, while σ determines its width. A normal distribution with a low standard deviation has a thin but high appearance because most observations stack up around the mean. Conversely, a normal distribution with a higher standard deviation appears thicker and smaller.
As you can see, the normal distribution is symmetric.
The normal distribution extends over the whole set of real numbers. So, the values x that the random variable X can theoretically assume any real number.
x \in I\!R
The formula for the probability density function that describes the distribution of X is
p(x|\mu, \sigma^2) = \frac{1}{\sqrt{2\pi\sigma^2}}e^{(-\frac{(x- \mu)^2}{2\sigma^2})}How to Calculate the Z Score
The Z score refers to the number of standard deviations from the mean and can be calculated as follows.
Z = \frac{x-\mu}{\sigma}For example:
If you have an observation x = 3 drawn from a standard normal distribution with mean 1 and standard deviation 2, you can calculate the Z score.
Z = \frac{3-1}{2} = 1Your observation is exactly one standard deviation above the mean.
The Z score of any normal distribution follows a standard normal distribution. Accordingly, random variables that follow a standard normal distribution are also called Z variables.
The Standard Normal Distribution
The standard normal distribution has a mean of 0 and a standard deviation of 1.
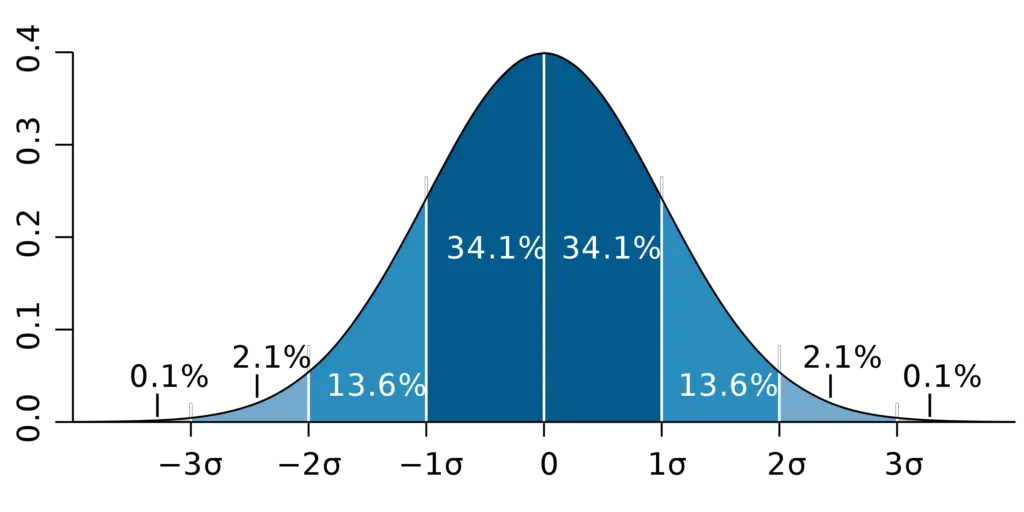
Given a standard normal distribution, we can immediately use some standard knowledge about the data.
- 68.2% of the data lie within one standard deviation from the mean
- 95% lie within 2 standard deviations from the mean
- 99.8% lie within 3 standard deviations from the mean
- The 10th percentile is -1.28 standard deviations from the mean
- The 5th percentile is -1.645 standard deviations from the mean
- The 2.5th percentile is -1.96 standard deviations from the mean
- The 1st percentile is -2.33 standard deviations from the mean
By symmetry, the same positive standard deviation values apply to the 90th, 95th, 97.5th, 99th percentiles.
For example, we can infer immediately that the point at which our standard normal random variable X assumes a value that is above the 95th percentile (in the top five percent) lies 1.645 standard deviations above the mean.
P(\frac{X-\mu}{\sigma} > 1.645) = 0.05If you need to obtain a specific probability interval along the normal probability density function, you can calculate it by integrating the area under the curve.
Properties of the Normal Distribution
There are a few interesting properties that make the normal distribution so widespread. I’ll list the most important ones here.
- Multiplying a normal random variable by any constant results in another normal distribution.
- Adding two normal random variables results in another normally distributed random variable.
- The sample means of normal distributions are normally distributed themselves.
- A lot of random variables approach a normal distribution given a large enough sample size
Summary
We’ve introduced the normal distribution and its properties. We’ve also learned how to calculate Z scores.
This post is part of a series on statistics for machine learning and data science. To read other posts in this series, go to the index.


