What is a Convolution: Introducing the Convolution Operation Step by Step

In this post, we build an intuitive step-by-step understanding of the convolution operation and develop the mathematical definition as we go.
A convolution describes a mathematical operation that blends one function with another function known as a kernel to produce an output that is often more interpretable. For example, the convolution operation in a neural network blends an image with a kernel to extract features from an image.
Understanding the Convolution Operation
As the name implies, you are sort of wrapping one function, the kernel, around another function. Let’s gain an intuitive understanding of how this works with a simple example.
Suppose you are a tour operator and you are offering a tour that takes 3 days. Guests can start the tour on any day. This means on any given day; you need to take care of the guests that are starting on that day, as well as those who are on their second and third days. On day 1 of their tour, people take two meals at their hotel, and you need to provide them with one meal for the trip. On day 2, it is 2 meals, and on day 3 they take a full day trip, so you need to get them 3 meals.
Let’s say you have 10 people start on day one, 8 people on day 2, and 5 people on day 3, 4 people on day 4. How do you keep track of the number of meals you need to prepare each day?
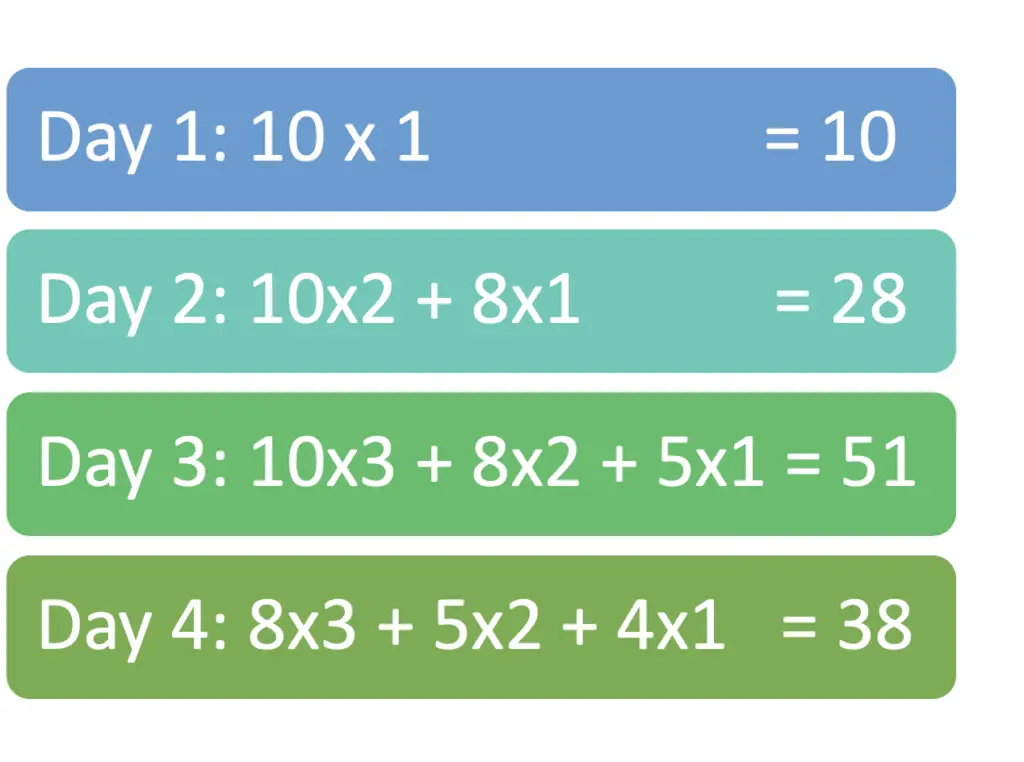
The first option is to create a separate calculation for every day. On the first day, you have 10 people requiring 1 meal each. On the second day, the 10 people are on their second trip, which requires 2 lunch packages for each, and you have 8 people who start on their first day, etc.
How to Calculate the Convolution
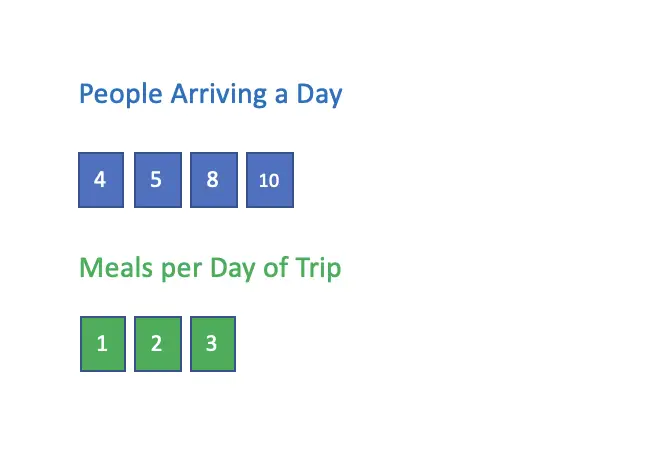
Another more convenient and intuitive way is to represent the number of people arriving per day in a grid and the number of meals per day in another grid.
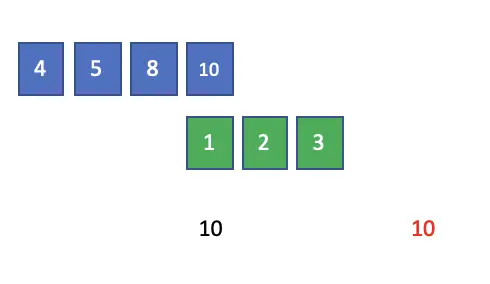
As you may have recognized, we reversed the grid representing the people arriving per day. So the last day, which has 4 people arriving is listed first, while the first day with 10 people is listed last. You’ll see why we do this in a minute. Now, we can slide the meals per day as a window over the grid that contains the people arriving each day in reverse and calculate the total.
1D Convolution
On the first day, the first 10 people go on the first trip requiring 1 meal. We move the first position in the green grid over the last position in the blue grid. Then we multiply the blue entry by the green entry right below it.
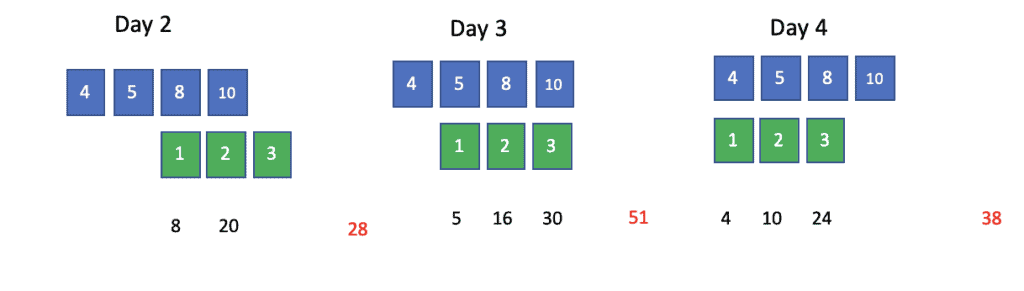
On subsequent days we shift the green grid to the left by one position, multiply each blue entry by the green entry below it, and add up the results.
Convolutional Kernel
Voilà, we have just convolved the blue grid with the green grid. The green grid that contains the meal plan per day is our kernel which we convolve with the blue grid containing the number of people. The result is the number of meals we need to prepare for each day to accommodate all of our clients.
Mathematical Definition of the Convolution
To translate the calculations, we have done into mathematical notation, we need to translate the grids into mathematical functions.
Our tour plan has three days which we denote as d. On each day, we need to provide a different number of meals. Let’s call the function that calculates the number of meals for a given day f. That is, the number of meals is a function f of d. This function is equivalent to the green grid or the kernel in the previous example.
\color{green} f(d)Then we define another function g that tracks the number of people participating in the tour that day. This function is equivalent to the blue grid.
\color{blue} g(d)You might remember to calculate the convolution; we reversed the blue grid. This means we need to define g as a function of negative d.
\color{blue} g(-d)
Lastly, we also need to track what day it is in absolute terms to know how many people arrive that day. We introduce the variable t, which is a running count of the days that helps us track how many people arrive each day. The variable t is not the same as d. Variable d tells us on what day of the tour plan we are, whereas t tells us what day it is in terms of the arriving visitors.
To find the correct number of people arriving that day as defined in the blue grid, we need to input the current day t into g of negative d.
\color{blue} g(-d + t)If this is a bit confusing, here is what this function tells us in plain English:
On day t, we have g(-d + t) people who are on day d of the tour. For example, on day 3 we have 8 people who are on day 2 of their tour.
The function f(d) tells us that on day d of the tour we need to prepare f(d) meals per person. For example, on day 2 of the tour, we need to prepare 2 meals per person.
Multiplying the two functions gives us the total number of meals for one day d of the tour. For day 1 of the tour, we perform the following calculation. But since we want the total number of meals to prepare for that day, we have to sum over all days d of the tour.
This gives us the convolution operation for discrete variables.
\sum_{d}^{D} \color{green} f(d ) \color{blue} g(-d + t)
In the previous example, we used the summation sign because days are discrete, countable instances.
In most textbooks, the convolution operation is defined for continuous functions. Therefore, we need to integrate over the two functions instead of calculating the sum.
\int \color{green} f(d ) \color{blue} g(-d + t)In most textbooks, the convolution operation the order of d and t is changed in the function g.
\int \color{green} f(d ) \color{blue} g(t-d)In mathematical notation, we write the convolution of two functions or signals like this.
f * g
The convolution operation is commutative, which means that we can change the order of the functions.
f * g = g*f
This article is part of a blog post series on deep learning for computer vision. For the full series, go to the index.

