The Coefficient of Determination and Linear Regression Assumptions

We’ve discussed how the linear regression model works. But how do you evaluate how good your model is. This is where the coefficient of determination comes in. In this post, we are going to discuss how to find the coefficient of determination and how to interpret it.
What is the Coefficient of Determination?
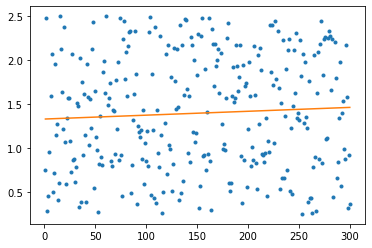
The coefficient of determination tells you what proportion of the variance in your predicted variables can be explained by the predictors. It is a value between 0 and 1 and usually denoted as R^2 (R squared in statistics). In some edge cases, R2 can be negative
How to Interpret the Coefficient of Determination?
if your determination coefficient is 1, your predictors perfectly predict your dependent variables. If it is 0, your predictors tell you nothing about the value of the dependent variable. What value is acceptable depends on your problem at hand. But in general the closer your coefficient of determination is to 1, the better your model.
How to find the Coefficient of Determination?
In regression analysis, two important terms are the sum of squared residuals (SSR) and the sum of squared totals (SST).
The SST calculates the sum of squares between the observations of the dependent variable and their mean.
SST = \sum_{i=1}^n (y_i - \bar y)^2The SSR calculates the difference between the observations of the dependent variable y_i and the corresponding value predicted by the model p_i.
SSR = \sum_{i=1}^n (y_i - p_i)^2The sum of squared residuals is also known as the sum of squared errors.
Coefficient of Determination Formula
The coefficient of determination is simply one minus the SSR divided by the SST.
R^2 = 1- \frac{SSR}{SST}Note that R2 could theoretically be smaller than zero if the SSR is larger than the SST. This is possible if the regression line goes against the trend. In this case, the sum of the squared distances between the data points and the line could be larger than the difference between the data points and their mean.
Coefficient of Determination Example
To make this clear, let’s calculate the coefficient of determination using the data and the model we’ve used in a previous post on the least squares regression line.
| x (Age) | y (Height) | xy | x^2 | y^2 |
| 8 | 1.5 | 12 | 64 | 2.25 |
| 9 | 1.57 | 14.13 | 81 | 2.47 |
| 10 | 1.54 | 15.4 | 100 | 2.37 |
| 11 | 1.7 | 18.7 | 121 | 2.89 |
| 12 | 1.62 | 19.44 | 144 | 2.62 |
| 50 | 7.93 | 79.67 | 510 | 12.6 |
p = 0.037x + 1.216
If we plug x into our model, we get a vector of predicted values.
p = [1.512, 1.549, 1.586, 1.623, 1.66 ]
By plugging y and p into the formula for the SSR and the SST, we get the following values.
SSR = (1.5 - 1.512)^2 + (1.57 - 1.549)^2+...+(1.62-1.66)^2
SSR = 0.01
SST = (1.5 - 1.586)^2 + (1.57 - 1.586)^2+...+(1.62- 1.586)^2
SST = 0.0239
Finally, we can calculate the determination coefficient.
R^2 = 1 - \frac{0.01}{0.0239} = 0.58Our model predicts roughly 58% of the variability in the outcome.
The coefficient of determination alone is not enough, though, to decide how good a model is. When fitting a regression model, several assumptions need to be satisfied. For example, if the dependent variable and the independent variable are not linearly correlated, R^2 is not helpful.
Linear Regression Assumptions
When deciding whether a linear regression model has a good fit, solely relying on R2 is not a good idea. The following four datasets have the same regression line, but vastly different distributions.
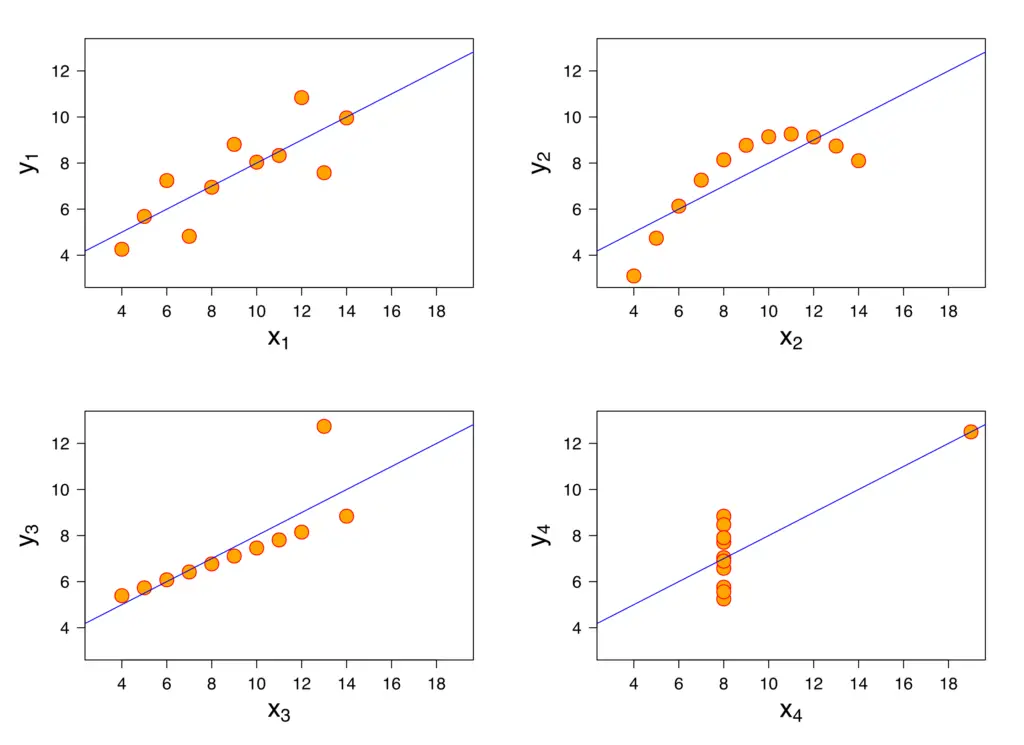
For all but the first dataset, a linear regression line is not an appropriate model.
The following assumptions generally need to be satisfied before linear regression analysis is appropriate.
- Linearity: the predictors X and the predicted variable Y are linearly related.
- Normality: The predicted variable Y follows a normal distribution for any value of X.
- Independence: Observations are not dependent on each other.
- Homoscedasticity: All values of the independent variable x have the same finite variance.
Summary
We’ve learned how to calculate the coefficient of determination and how to use it to evaluate a linear regression model. Furthermore, we’ve discussed the assumptions that need to hold for a linear regression model to be appropriate.
