Rise Over Run: Understand the Definition of a Derivative

We introduce the basics of calculus by understanding the concept of rise over run, followed by a more formal definition of derivatives.
At the heart of calculus are functions that describe changes in variables. In complex systems, we usually deal with many changing variables that depend on each other.
The concept of rise over run describes to what extent a change in one variable leads to a change in another variable. Geometrically it can be visualized as a right-angled triangle where an increase in the length of one side (run) leads to an increase in the length of the adjacent side (rise).
Rise over run is defined as the slope expressed by the hypotenuse in a right-angled triangle. In calculus, we are interested in the change of the slope when the length of a side in the right-angled triangle changes.
Let’s look at a concrete example to make this a bit easier to understand.
Let’s say that we increase x by a small amount, which we denote dx. And assume that this change in dx increases y by the quantity dy. We can visualize this as a right-angled triangle in which x forms the base and y the height.
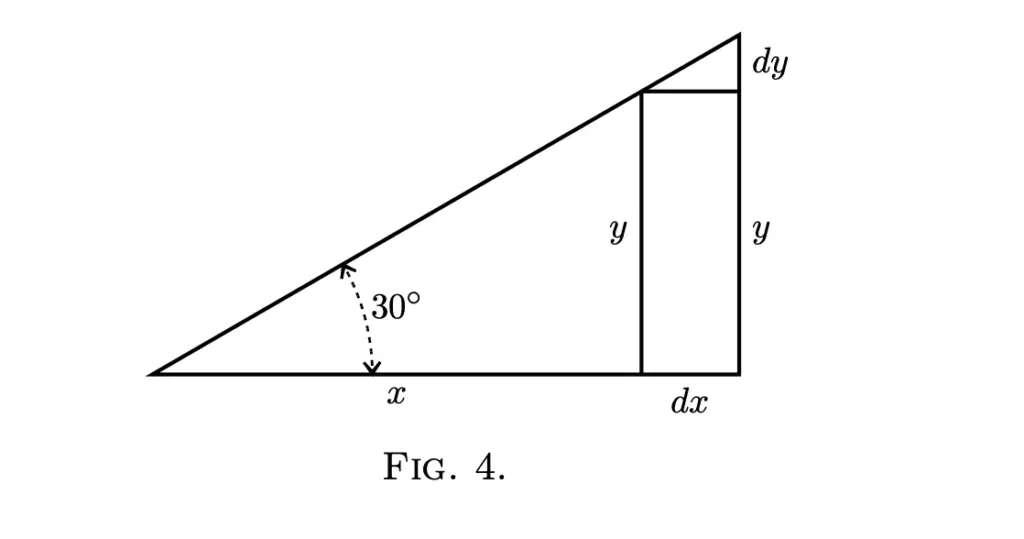
If we add dx to x, it will cause an increase in y by dy. This corresponding change in dy can be described as a ratio.
\frac{dy}{dx}The expression dy describes a rise in y, whereas dx describes the run (the change in x by dx), which is why this ratio is known as the “rise over run”. In geometric terms, “rise over run” is the slope of our hypotenuse. Now you might ask why do we need calculus for that if simple geometry is enough?
Well, in this case, our hypotenuse is just a straight line. The ratio between dy and dx is the same at every point. It is also equivalent to the ratio of y to x.
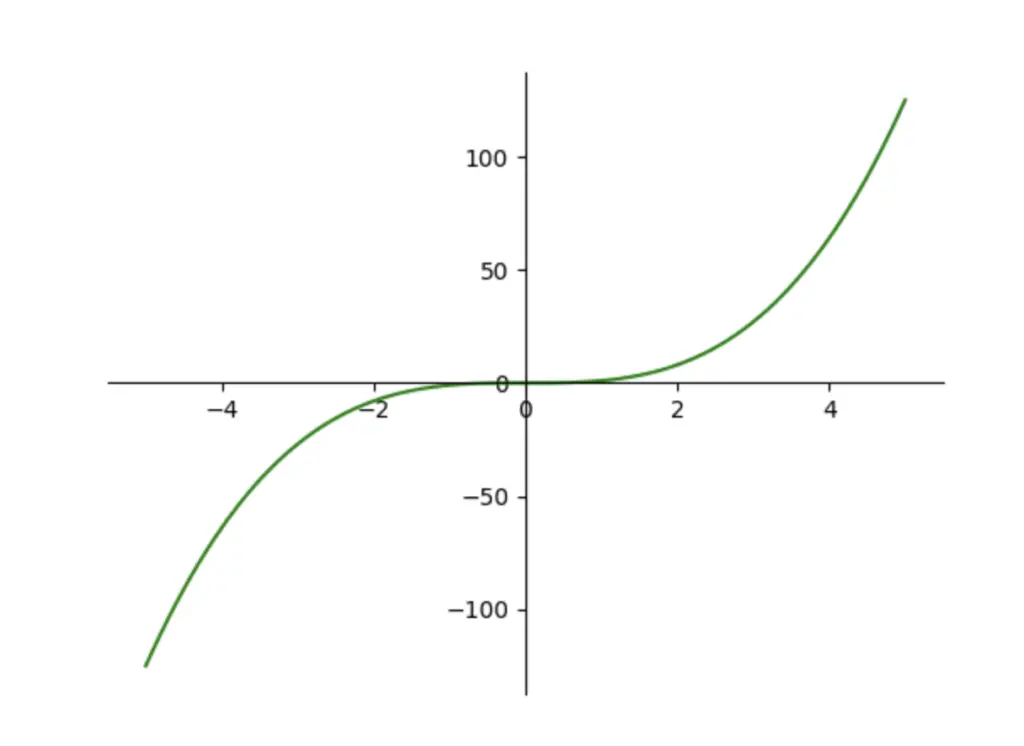
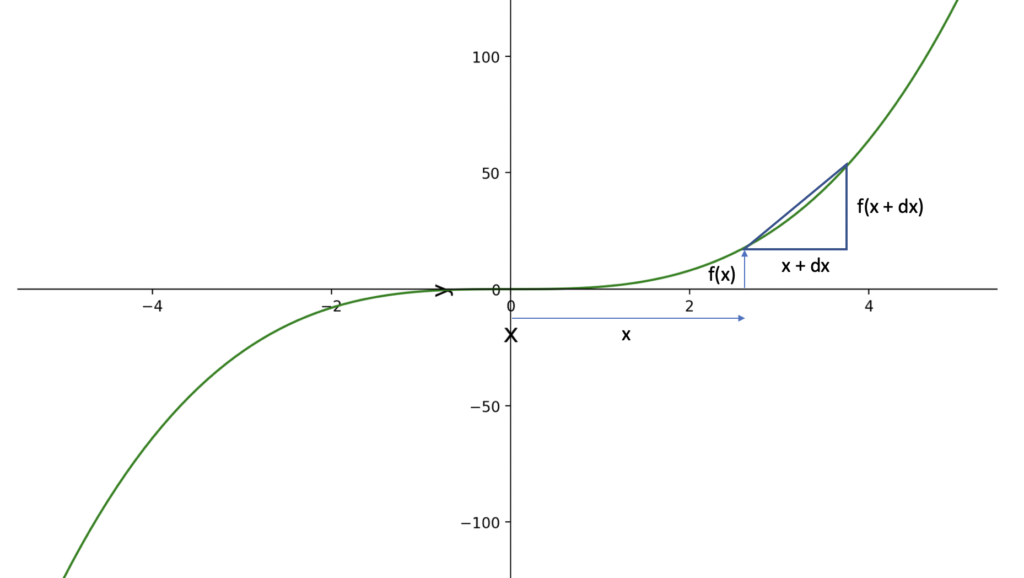
But what do we do if, instead of the hypotenuse in the previous image, we need to find the slope of a non-linear graph like this one?
The slope and, therefore, our “rise over run” constantly change as you move along the line. In other words, the slope itself becomes a non-linear graph (plotted in blue).
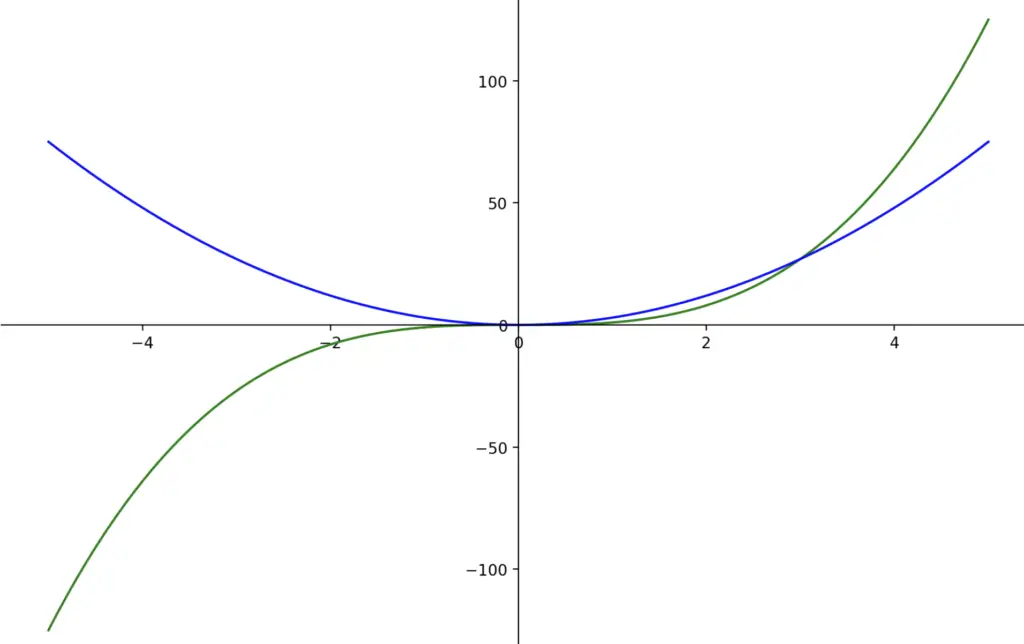
As you can see, the green graph gradually loses steepness until the slope is zero at the origin. The blue graph captures this change in the slope of the green graph. Accordingly, it also reaches zero at the origin. Following the origin, the green graph slowly picks up steepness, which also results in a gradual increase in steepness in the blue graph.
In the real world, the green graph could model the deceleration of a car until it comes to a halt at a traffic light. After the traffic light has turned green, it slowly starts to accelerate again. So the green graph captures the actual change in speed while the blue graph records the rate of change in speed at every point in time.
Definition of the Derivative
It should be obvious by now that we cannot capture the slope of the green graph in a simple slope of y over x.
To determine the slope of the green graph, we would have to create an infinite number of infinitely small right-angled triangles at every point along the line. Now this infinitely small ratio you obtain at every one of these triangles is known as the differential, and it is expressed as
\frac{dy}{dx}where d stands for delta. It is known as the differential, and the blue graph that captures the rate of change at every point on the green graph is known as the derivative of the green graph. Of course, x and y have to be somehow related in order to obtain this ratio. We can therefore express the derivative as a function itself.
How do we arrive at this function?
Remember, in a graph, y is usually expressed as a function of x. We can express our green graph as
y = x^3
More formally, we would say:
f(x) = x^3
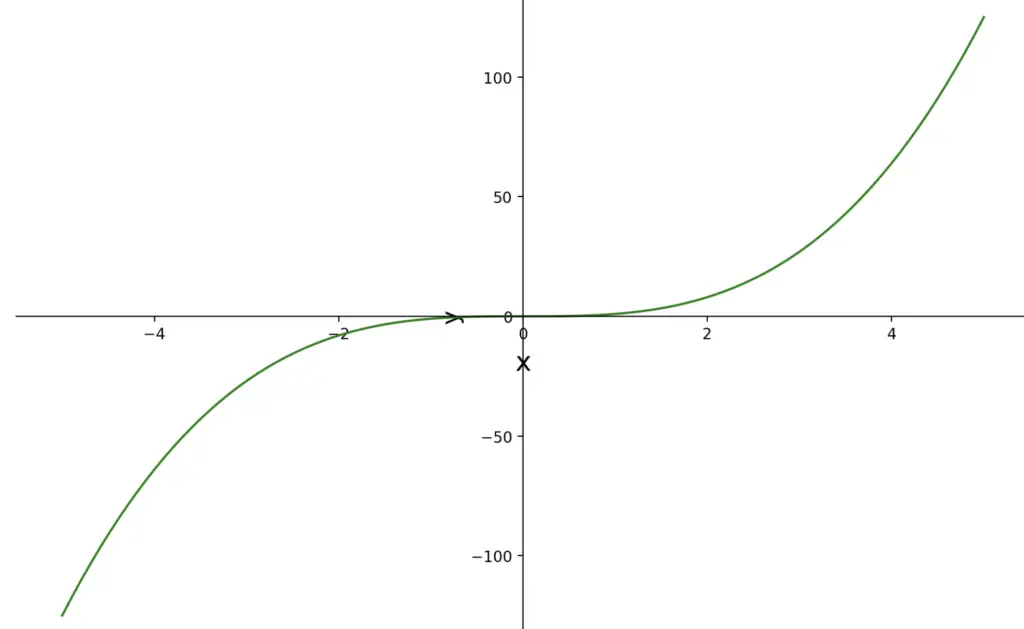
So f(x) is basically a different expression for y in this case. You could create a right angled triangle along the graph of f(x), from any point (x, f(x)) to another point (x + dx, f(x + dx)).
Rise over Run Formula
Accordingly, you would arrive at the slope of this triangle by the following calculation.
\frac{rise}{run} = \frac{dy}{dx} = \frac{f(x + dx) - f(x)}{(x + dx) - x} = \frac{f(x + dx) - f(x)}{dx}Since the slope is changing continuously in a non-linear graph, we need to make the triangle as small as possible, in fact infinitely small, to arrive at the correct slope at that point. As we cannot really calculate the slope of an infinitely small triangle, we can only approximate it by getting x as close to zero as possible.
\lim_{dx\to0}\frac{dy}{dx} = \lim_{dx\to0}\frac{f(x + dx) - f(x)}{dx}This post is part of a series on Calculus for Machine Learning. To read the other posts, go to the index.
