Multivariate Gaussian Distribution
In this post, we discuss the normal distribution in a multivariate context.
The multivariate Gaussian distribution generalizes the one-dimensional Gaussian distribution to higher-dimensional data. In the absence of information about the real distribution of a dataset, it is usually a sensible choice to assume that data is normally distributed. Since data science practitioners deal with highly-dimensional data, they should have an understanding of the multivariate Gaussian.
Multivariate Gaussian Distribution
Remember, that the normal distribution is defined by mean and variance.
p(x|\mu, \sigma^2) = \frac{1}{\sqrt{2\pi\sigma^2}}e^{(-\frac{(x- \mu)^2}{2\sigma^2})}To account for a multivariate Gaussian, we need a vector of means μ and a covariance matrix Σ instead of single numbers.
p(x|\mu, \Sigma) = \frac{1}{2 \pi ^{\frac{D}{2}}} |\Sigma|^{\frac{-1}{2}}
exp(-\frac{1}{2} (x - \mu) \Sigma^{-1} (x - \mu)^T)
I know, this looks scary at first, so let’s build intuition with some examples.
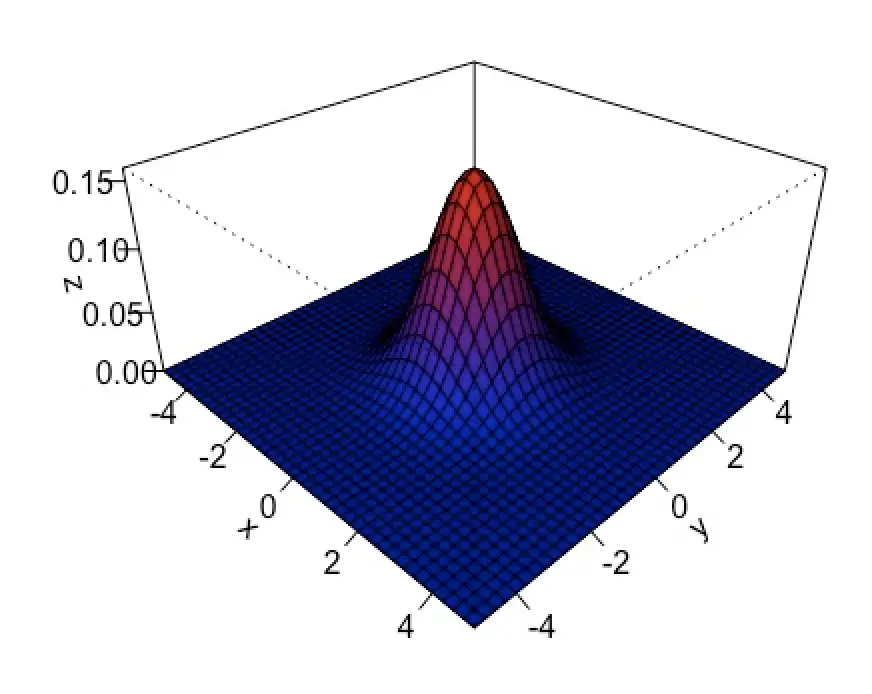
The univariate standard normal distribution has a mean of 0 and a variance of 1.
If we generalize to the bivariate case (2 dimensions x, and y), we have a vector μ with two mean values of zero to account for x and y. As for the variance, we represent multivariable cases in a covariance matrix that contains the variances on the leading diagonal. In the case of the standard normal distribution, the variance for x and y is 1.
\mu =
\begin{bmatrix}
0\\
0
\end{bmatrix}

\Sigma =
\begin{bmatrix}
1 & 0\\
0 & 1
\end{bmatrix}
If you are familiar with linear algebra, you’ll probably recognize that in the case of the standard normal distribution, Σ is the identity matrix.

Now, you can generalize this form to any number of dimensions.
Summary
Gaussians are an essential distribution in machine learning and data science. Understanding them in multivariate scenarios goes a long way to make you a better data scientist or machine learning practitioner.
There are several more properties of multivariate Gaussians that are beyond the scope of this post. If you are interested in the manipulations you can perform on them, I recommend getting your hands on Christopher Bishop’s book “Pattern Recognition and Machine Learning”.
In my opinion, it doesn’t make sense to go through more manual examples in the multivariate case. The ideas are the same as for the univariate case, and in almost all cases you’ll have a computer do the calculations for you.
This post is part of a series on statistics for machine learning and data science. To read other posts in this series, go to the index.


